How to Read Crypto Charts: 7 Basics Every Beginner Should Know
Learning how to read crypto charts feels like learning a new language at first. Bars go up and down, lines cross each other, and every exchange shows a screen full of numbers that seem to move every second. The good news is that you do not need to understand everything on day one. A few basic ideas explain most of what a chart is telling you. Here are seven basics that will help you read any crypto chart with more confidence.
1. What a Crypto Chart Actually Shows
A crypto chart is simply a picture of price over time. The horizontal axis shows time — minutes, hours, days, or weeks — and the vertical axis shows price in dollars. When the line moves up, buyers were willing to pay more than before. When it moves down, sellers were willing to accept less.
That is all a chart really is: a record of what people actually paid, not what anyone thinks will happen next. A chart cannot tell you the future. It can only show you what has already happened and how fast it happened.
2. Candlesticks: The Green and Red Bars
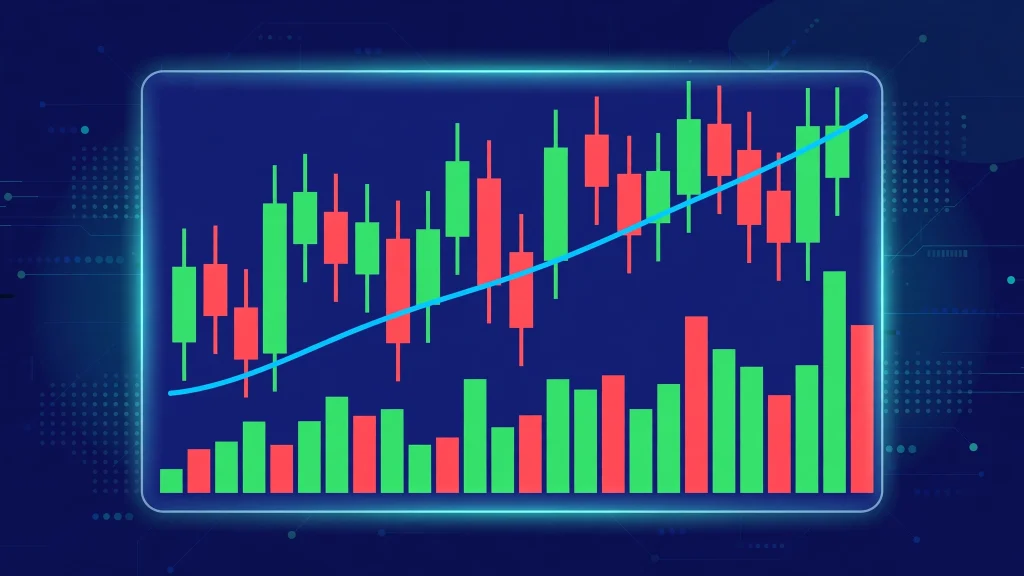
Most crypto charts use candlesticks, and each candle covers one period of time. On a 1-hour chart, each candle shows one hour of trading. A green candle means the price closed higher than it opened during that hour. A red candle means it closed lower.
Each candle has a thick body and thin lines sticking out of the top and bottom, called wicks. The body shows where the price opened and closed. The wicks show how far the price travelled during that period — the highest and lowest points it reached before closing.
When you see several green candles in a row, buyers were in control during that stretch. Several red candles in a row mean sellers were in control. That is the first thing most traders look for, and you can read it in seconds.
3. Timeframes Change the Story
The same coin can look completely different on different timeframes, and this confuses many beginners. On a 5-minute chart, Bitcoin might look like it is crashing. On a daily chart, the same day might look like a small dip inside a steady climb.
Short timeframes show noise — quick moves that often reverse within hours. Long timeframes show the bigger picture — the direction of the market over weeks and months. Beginners usually learn more from the daily chart than from the 5-minute chart, because the daily chart filters out the panic and excitement of a single hour.
A useful habit is to check two timeframes before forming any opinion: the daily chart for direction, and the 4-hour chart for what is happening right now.
4. Volume: How Many People Are Trading
Volume is the number of coins traded during a period, and it usually appears as bars at the bottom of the chart. It answers a simple question: how many people actually took part in this move?
A price jump on high volume means lots of people were buying, which makes the move more meaningful. A price jump on very low volume means only a few trades moved the price, which makes the move easier to reverse. The same rule works in reverse: a sharp fall on huge volume shows strong selling, while a fall on tiny volume may be nothing more than a quiet market drifting.
5. Trend Lines, Support, and Resistance
A trend is simply the general direction of the price. An uptrend is a series of higher highs and higher lows. A downtrend is a series of lower highs and lower lows. Drawing a line through the highs or lows of a trend — a trend line — helps you see that direction clearly instead of guessing.
Two words come up constantly in chart reading. Support is a price level where buyers have stepped in before, so the price has bounced up from it more than once. Resistance is a price level where sellers have stepped in before, so the price has turned back down from it more than once. These levels are not walls, and they do break — but they are useful because many traders watch the same levels, so they often become places where the market pauses or turns.
6. Moving Averages Smooth Out the Noise
A moving average is the average price over a set number of periods — for example, the last 50 days or the last 200 days — drawn as a smooth line on the chart. Because it averages many prices together, it moves more slowly than the price itself, and that is the point: it shows the trend without the daily noise.
When the price is above its 50-day moving average, the recent trend has been up. When it is below, the recent trend has been down.
7. Indicators Like RSI Are Helpful, Not Magic
Charts often come with extra tools called indicators. One of the most popular is the RSI, or Relative Strength Index, which measures whether a coin has risen or fallen unusually fast over the last 14 periods. A very high reading suggests the coin may be overbought, and a very low reading suggests it may be oversold. Our guide on what RSI is in crypto explains it in detail.
The important thing to remember is that indicators describe the past, just like the chart itself. An overbought reading does not mean the price must fall tomorrow — strong coins can stay overbought for weeks. Indicators work best as a second opinion, not as a decision-maker.
The Bottom Line
Learning how to read crypto charts comes down to seven basics: price over time, candlesticks, timeframes, volume, trend lines with support and resistance, moving averages, and indicators like RSI. None of them predicts the future, but together they help you understand what the market has actually done — and that is a much better starting point than guessing.
Before you act on anything a chart seems to say, do the same research you would do before buying any coin. Our guide on how to research an altcoin before you buy it walks through seven checks that pair well with chart reading.
If this guide helped you read your first crypto chart, share it with a friend who is staring at the same confusing screen — it might be the clearest explanation they read all week.
Disclaimer: This article is for educational purposes only and is not financial advice. Cryptocurrency prices are volatile. Always do your own research before buying any crypto asset.