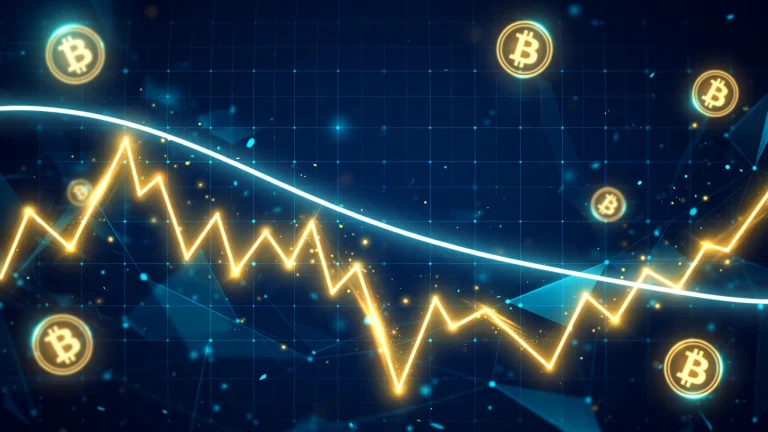
What is a 200-day moving average? The 200-day moving average is a single smooth line on a price chart that shows the average closing price of an asset — like Bitcoin — over the last 200 days. It turns months of noisy daily swings into one clear line showing the long-term trend. When Bitcoin fell…
Read More »